A large diagram is easier to understand when you can switch between the whole system and a focused question. Visual Nerve offers several tools for that job. They all refer to the same saved objects and connections.
| You want to… | Use |
|---|---|
| See the main areas of a dense diagram | Understand → Semantic overview |
| Inspect nearby objects or a connecting path | Explore relationships and views in Properties |
| Ask what is upstream or downstream and inspect evidence | Understand → Ask diagram |
| Return to a particular analysis perspective | A named analysis view |
| Save a recoverable point and review what changed | Understand → Version history |
On phones, open Diagram actions for Semantic overview, Ask diagram and Version history. To explore from a particular object, select it, choose Edit, then Explore relationships and views in the properties sheet.
Start with a semantic overview
- Open Understand → Semantic overview.
- Enable Summarize related objects.
- Choose Grouping: hierarchy/tags/source automatically, diagram hierarchy, primary tag, or source files and SQL schemas.
- Close the dialog and inspect the summary cards. They show how many original objects they represent and summarize status.
- Expand a summary card or zoom into the 2D overview to reveal deeper detail. In 3D, select a summary card or its entry in the object list.
- Use Back one level to close the latest expanded branch, Collapse to overview to close all expansions, or Details to return to the editable original layout.
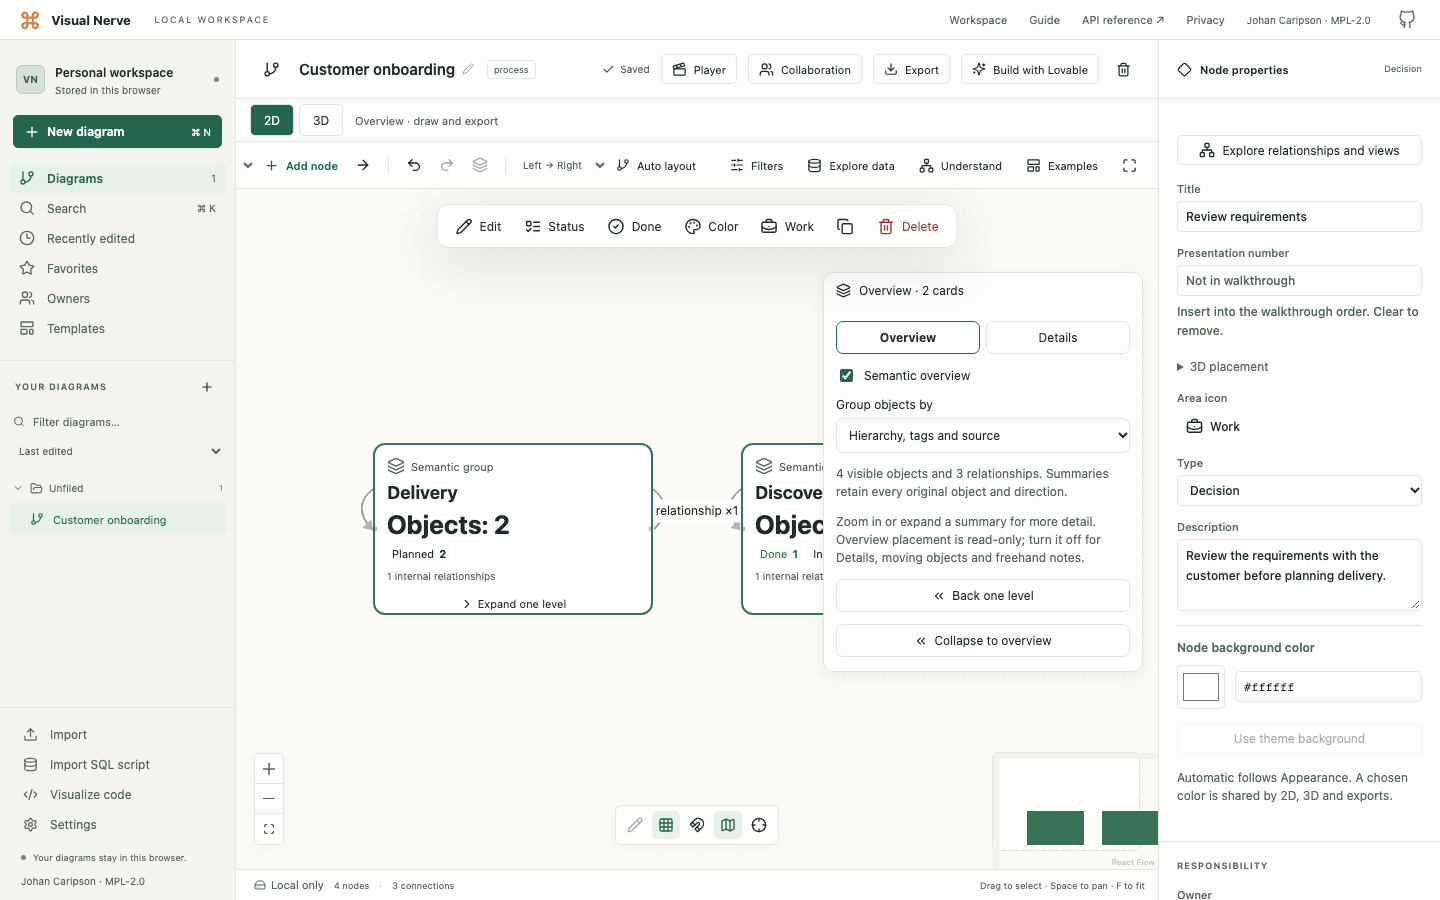
For a code project, grouping by source can show files first and declarations when you expand them. For a delivery workflow, grouping by hierarchy can show Planning, Dispatch and Delivery before revealing their individual tasks.
An aggregate connection retains its original relationship type and direction and tells you how many connections it represents. Relationships within a group remain represented as internal aggregates. Objects without meaningful hierarchy, tags or source information use clearly labelled layout areas or stable partitions. Those partitions help navigation; they do not establish a business category.
Summary placement is read-only. Return to Details to move original objects or edit the native layout. Grouping does not delete nodes or replace their descriptions, colors, icons, status or links. Existing CSV filters and relationship focus still determine which objects enter the overview. Pen marks remain in Details because their coordinates belong to that layout.
The projection displays at most 2,000 cards while retaining mappings to its original objects and relationships. A low visible card count is not a reduced data population. JSON and Markdown continue to describe the original graph.
Explore neighbors and paths
Use this for a quick visual investigation from a selected object.
- Select a node and open Explore relationships and views in Properties.
- Choose Connected neighbors.
- Select Incoming, Outgoing or All relationships, then One step or Two steps.
- Choose Explore relationships to show the resulting neighborhood.
- Use Reset exploration when you want the ordinary view again.
For a route between two objects, choose Shortest path, search for a destination and decide whether Follow relationship directions should be enabled. A directed path follows arrowheads. An undirected path can inspect how objects are associated even when the connection has no arrow.
For example, explore outgoing relationships from Invoice preparation to see its immediate consumers. Increase to two steps to see the next layer. Then find a shortest path to Payment received to inspect one modeled route between them.
Exploration narrows the display without deleting content. It can temporarily reveal filtered objects or collapsed branches. The focused view is limited to 500 objects and 2,000 connections; a notice tells you when to refine a larger result.
Retained CSV groups outside the current data view are excluded by default. If you enable Include groups outside the current data view, those groups are labelled Outside current data view. Their saved measures may come from earlier analysis choices and should not be mistaken for current totals.
Ask a question and read the evidence
Ask diagram examines modeled relationships locally. It does not require an AI service and does not execute imported code or SQL.
- Open Understand → Ask diagram and choose a Start object.
- Choose downstream, upstream, or how two objects are connected. The last choice also needs a destination.
- Set Maximum steps and optionally a Relationship type.
- Decide whether to include heuristic/unresolved connections or retained CSV groups outside the current view.
- Choose Ask diagram.
- Expand Why is this connected? in an answer to inspect its path and retained source evidence. Use the focus action to show the related objects or path on the canvas.
The source of a relationship changes how you should interpret it:
| Evidence | Meaning |
|---|---|
| Manual connection | A relationship modeled by a user |
| Code syntax evidence | A recognized static reference with file/line information |
| Heuristic or unresolved code reference | A possible or incomplete link requiring review |
| SQL foreign key | A recognized schema relationship |
| SQL JOIN expression | A logical connection in the query |
| CSV group/source evidence | A generated relationship based on the saved analysis |
An answer describes the diagram’s structure. It does not prove that a function ran, a database query executed, or a business outcome was caused by the connection. Directions and cycles are handled explicitly; unarrowed associations are excluded from directed question paths.
Questions support up to 64 steps and paged answers, bounded to 50,000 objects and 200,000 relationships. Depth, uncertainty and truncation notices matter. If the graph changes after you ask, ask again before focusing old results.
Save an analysis perspective
A named analysis view is useful when you repeatedly switch between questions such as Blocked orders, Customer AAA and Supplier dependencies.
- Set your filters, source grouping, relationship focus, layout and viewport.
- Open Explore relationships and views.
- Enter View name and choose Save current view.
- Later, select it under Saved view and choose Load view.
- Use Update saved view after refining the perspective, or Delete saved view to remove it.
A view stores analysis settings, relationship configuration, focus, geometry, collapsed branches and viewport over shared source data. It does not duplicate the CSV rows. Notes, status, drawing marks and manual connections remain current when you load another view. Save/load operations support undo and redo.
Save and compare local versions
History preserves recoverable diagram content. It serves a different purpose from both a named analysis view and Undo/Redo.
- Open Understand → Version history.
- Enter a Snapshot name, such as
Before billing redesign, and choose Save snapshot. - Make your changes.
- Reopen history, choose that Snapshot, and set Compare with → Current diagram.
- Choose Review changes.
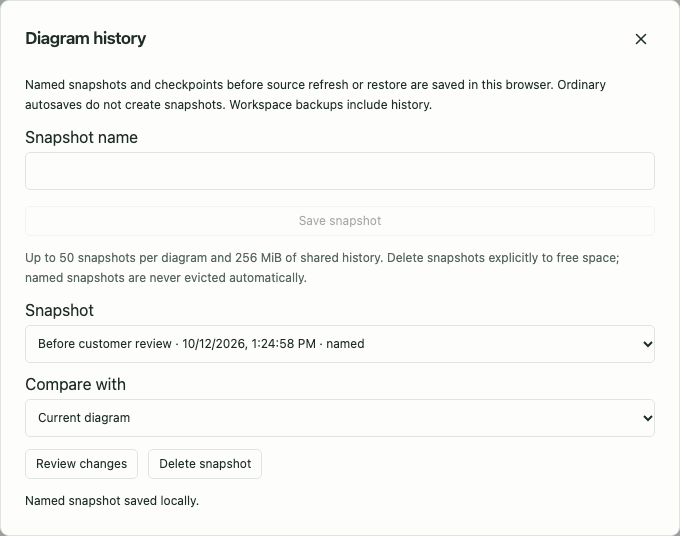
Comparison reports added, removed and changed objects, connections, source content, settings and calculations. Routine camera movement and save timestamps are ignored. It also shows which objects may be affected through modeled dependencies; this is structural impact, not a runtime guarantee.
Detailed lists show up to 500 changes and bounded affected references, while the counts include all changes. Read truncation warnings before treating the visible list as exhaustive.
Read the comparison direction carefully: it runs from the selected snapshot to the comparison target. Restoring the snapshot reverses those changes. You can compare with another snapshot as well, without changing the current diagram.
Restore safely and manage history
To restore, compare a snapshot with Current diagram, review the result, check I reviewed the changes and want to restore this snapshot, then choose Restore reviewed snapshot.
Before replacement, Visual Nerve atomically creates a safety checkpoint of current work. If that checkpoint fails, or another tab changed the diagram after your review, replacement does not proceed. Review again after a concurrent edit. Saved IDs and exact 2D/3D positions are preserved. Owner assignments restore, while shared owner profiles keep their current details so another project’s owner registry is not rewound.
Ordinary autosaves do not create snapshots. Source refresh creates a pre-change checkpoint, and a restore creates a safety checkpoint. History remains separate from the temporary Undo/Redo stack.
History supports 50 snapshots per diagram, 1,000 per workspace, 256 MiB of shared archived content and 32 MiB per structural snapshot graph. Named versions are not silently evicted. To free space, choose Delete snapshot, then Confirm delete snapshot. Current work stays intact.
Snapshots can retain removed objects and original CSV rows. Removing a source from the current diagram does not remove rows needed by history. A complete workspace backup includes history; single-diagram JSON contains the current diagram only.
Choose the next step
Use connected data for source matching, refresh, quality checks and measure explanations. Use presentations to turn an investigation into an ordered explanation, or sharing to prepare a reviewed app brief. The same semantic tools are available through API and MCP .