Use connected data when one file cannot answer the whole question. For example, a customer list identifies companies, an orders file describes purchases, and a support file reveals which customers have open issues. Keep each source’s rows and totals, then explicitly connect the matching keys.
Desktop tools are under Explore data → Data sources / Data quality / Refresh source. On a phone, open Diagram actions and choose the same action. To explore an object’s connections or save a named view, select it and open Explore relationships and views in Properties; on a phone, tap Edit first.
Link two CSV files by a key
Start with a CSV diagram , then:
- Open Data sources.
- Choose Add CSV sources and load the additional files.
- Choose Match columns.
- Select From source, From column, To source and To column. For example, match Customers.Customer ID to Orders.Customer ID.
- Choose Match values: Trim whitespace, Exact text, or Trim and ignore case.
- Choose Preview match and inspect the counts.
- Choose Add this relationship.
- Finish adding sources and relationships, then choose Apply data model.
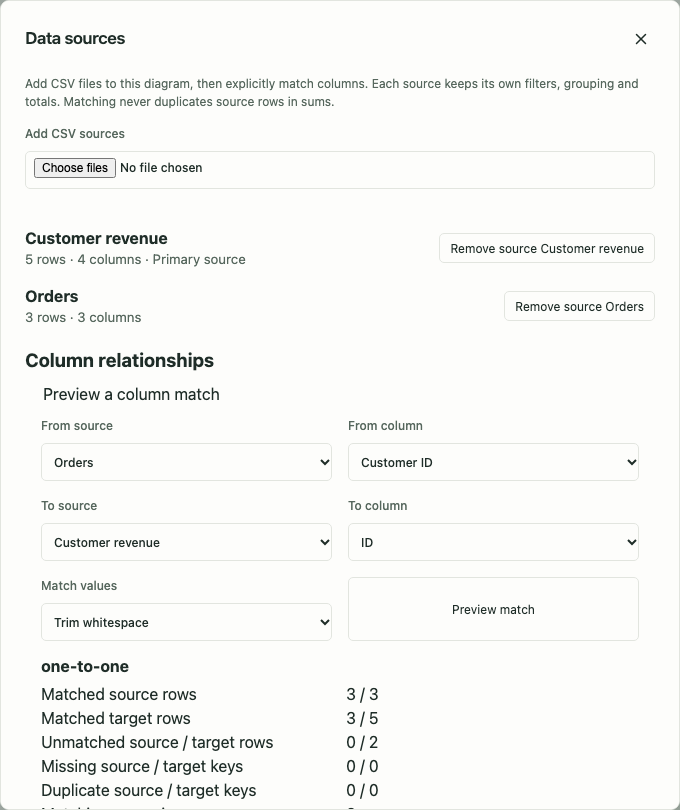
The dialog is a draft until you apply it. It lists sources and their row/column counts, and lets you remove a source or column relationship. Close to discard unapplied changes. If the diagram changes while the dialog is open, reopen it against the current version before applying.
You can also drop multiple CSV files together. When creating a new diagram, configure the first file before reviewing the remaining sources. On an open diagram, additional files can be added to its source model.
Read the match preview
| Result | What it tells you |
|---|---|
| Matched source / target rows | Rows whose key has a counterpart in the other file. |
| Unmatched source / target rows | Rows for which no counterpart was found. |
| Missing source / target keys | Rows with no usable key. |
| Duplicate source / target keys | Keys occurring more than once, which affect relationship cardinality. |
| Matching row pairs | How many pairs the keys describe; this can exceed either file’s row count. |
| Cardinality | Whether the match is one-to-one, one-to-many or many-to-many. |
Repeated Customer ID values in an orders file are normal. Repeated IDs in a file meant to contain one row per customer may reveal a data problem. The preview provides evidence; it does not automatically choose the business meaning.
Follow an entity without multiplying its totals
Each source retains its own cleanup, filters, grouping and measures. Select one of its generated objects to adjust those choices.
Choose Explore this group on a customer object to focus connected sources on matching entities. Choose All data to remove this connected focus.
Matching selects original source rows. It does not construct a duplicated joined table for aggregation: an order amount contributes once even if several related objects share the customer key. Display limits reduce the cards you see, not the matching rows used in totals.
Generated relationships are normal editable diagram connections. You can label, change, delete or reconnect them. A later analysis does not silently recreate a relationship you deliberately deleted or reconnected.
Explore the diagram’s relationships
Select an object and open Explore relationships and views.
For neighboring objects:
- Choose Connected neighbors in Explore.
- Choose All relationships, Incoming or Outgoing.
- Choose One step or Two steps.
- Choose Explore relationships.
For a path:
- Choose Shortest path.
- Search for and choose a Destination.
- Keep Follow relationship directions on to follow arrowheads, or turn it off to allow either direction.
- Choose Explore relationships.
Exploration changes the visible objects without deleting them or their links. It temporarily overrides ordinary object filters and collapsed branches. Choose Reset exploration to return.
Relationships without arrows can be traversed with All relationships or an undirected path. A missing directed path can mean the arrow directions or visibility settings exclude it; it does not necessarily mean the objects have no association.
Retained CSV groups outside the current data view are excluded by default. Include groups outside the current data view adds them with an explicit label, because their aggregates may describe an earlier analysis.
Exploration is bounded to 500 objects and 2,000 connections. The interface reports a truncated result. Destination search shows at most 100 matches; refine the search to find a different object. For richer evidence and upstream/downstream questions, see Understand large diagrams .
Save a named analysis perspective
In the same dialog, find Named analysis views:
- Configure the desired filters, source analyses, focus and layout.
- Enter View name, such as “AAA customers with open issues.”
- Choose Save current view.
- Later select it in Saved view and choose Load view.
Update saved view replaces its saved perspective with the current one. Delete saved view removes that saved perspective.
A view saves filters, source analysis configurations, column relationships, entity focus, exploration, geometry, collapsed branches and viewport. Source rows are shared between views. Notes, statuses, drawing marks and manual connections remain current when switching views.
Saving and loading views support Undo/Redo. If a view’s source bindings are no longer valid, resolve them instead of assuming it still calculates the same result.
An analysis view is a way to revisit a question over the current data. A version snapshot stores earlier diagram content and can restore it.
Explain a measure using its rows
Select a CSV group and choose Why this value? beside a measure. The explanation uses the current group, filters, cleanup, number formats and related-source scope. Inspect included, excluded and repeated rows, with original or cleaned cells and source data-row numbers.
The rows are paged for readability. Paging does not change the calculation. This is useful when a customer total differs from a spreadsheet: compare the filter scope and invalid numeric cells before changing the grouping.
See CSV exploration for the source-row workflow.
Inspect data quality
- Open Data quality.
- Choose the source.
- If uniqueness matters, explicitly select the identity columns.
- Select a check to inspect the affected rows.
- Compare original and cleaned values, then revise the import/analysis or correct the source file as appropriate.
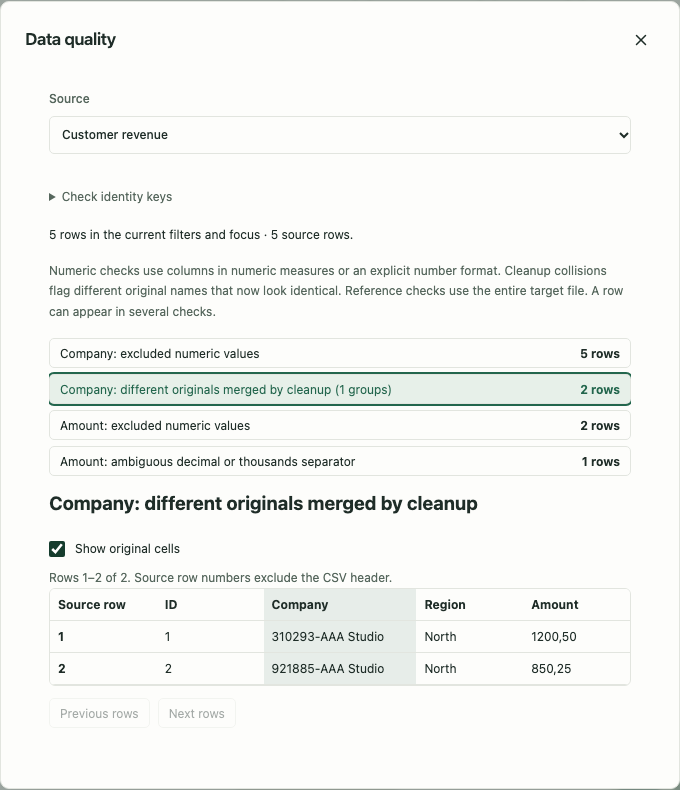
Checks cover empty cells, excluded numeric values, ambiguous formats, cleanup collisions, selected duplicate identities and missing referenced keys. Numeric checks apply to numeric measures or explicitly formatted columns, rather than declaring every text column an invalid number.
A row can appear in several checks. Duplicate IDs or cleanup collisions may be intentional in transaction data; diagnostics never automatically delete rows.
For SQL diagrams, quality concerns parsed structure, such as missing table definitions and unknown referenced columns. It does not inspect live table data or connect to a database.
Refresh a source and preserve your annotations
Refresh updates an existing source rather than importing an unrelated new diagram. It supports CSV sources and SQL table schemas.
Replace a CSV
- Open Refresh source and choose Source to refresh.
- Load the Replacement source file.
- Select one or more Identity keys that identify a source row.
- Open Map replacement columns and explicitly associate replacement columns with existing columns.
- Choose a policy under Removed source objects.
- Choose Preview changes.
- Inspect Review source changes, including manual connections affected and review notes.
- Choose Apply source refresh when the review matches your intent.
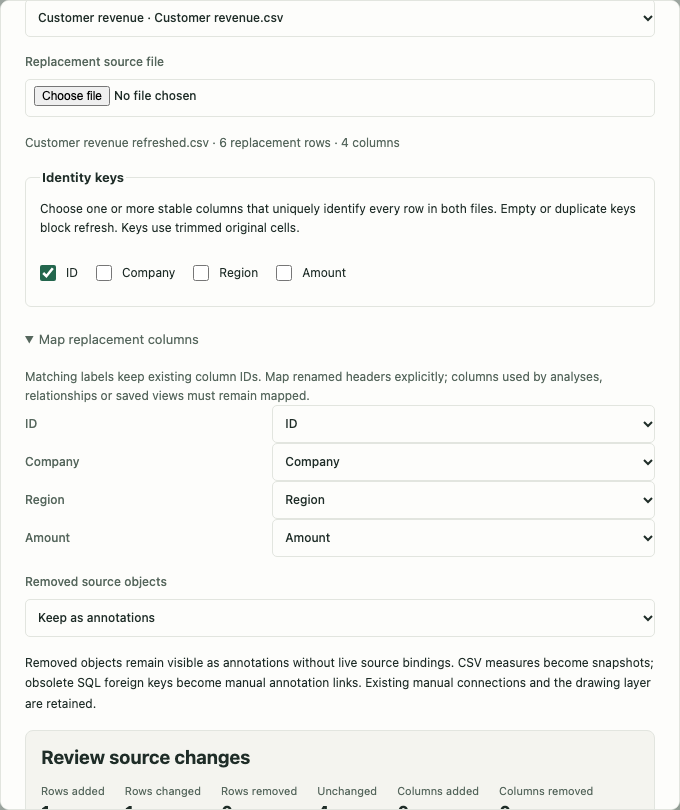
Use a stable row ID such as Order ID. Customer name alone is often unsuitable for transaction rows because it repeats. Empty or duplicate identities block an ambiguous replacement.
Unambiguous surviving objects retain their identifiers, placement, notes, status and manual connections. Group splits and merges are reported rather than guessing which annotations should move to a new group.
| Removed-source policy | Result |
|---|---|
| Keep as annotations | Removed objects remain without live source bindings. CSV measures become snapshots; obsolete SQL foreign keys become manual annotation links. Manual connections and drawing remain. |
| Remove objects and attached connections | Removed objects and all their incident connections are deleted. Matching objects and their manual connections remain. |
Replace a SQL schema
Choose the SQL source and load a replacement file or paste a schema script. Qualified table names and foreign-key column bindings identify existing tables and relationships. Review and apply the changes as above.
This does not execute SQL. SELECT diagrams are not refreshable query results, and source-code imports are not automatically re-analyzed by this tool.
Recover or discard a refresh
Close the dialog to discard an unapplied draft. Applied refresh supports Undo and creates a safety snapshot before applying. A concurrent edit or another tab’s change invalidates the preview; review the current version again before applying.
Limits and common problems
The connected model supports eight CSV sources, 32 column relationships and 20 million cells combined. Each source must also fit the selected import size and its own CSV limits. Background workers and bounded previews prevent the view from needing a card for every raw row.
| Problem | Useful next step |
|---|---|
| Many unmatched keys | Compare chosen columns, whitespace, case and missing values in the match preview. |
| Unexpected many-to-many relationship | Inspect duplicate keys in both sources; choose the intended business key. |
| A related total looks too small | Check each source’s own filters and connected focus, then use Why this value?. |
| A refresh cannot apply | Fix empty/duplicate identity keys, complete the column mapping, or regenerate a stale preview. |
| An old CSV group shows an earlier measure | Reset exploration or exclude groups outside the current data view. |
| A saved view no longer loads as expected | Review its source bindings after a source/relationship change. |
Sources, analysis views and annotations remain in this browser’s IndexedDB. Complete backups retain them; other browsers or computers have separate workspaces. Old source rows may remain in history snapshots until those snapshots or the diagram are deleted.
Continue with Understand large diagrams for semantic overviews and snapshots, SQL queries and schemas for SQL structure, or Sharing and export for outputs.