A data-flow diagram shows what information a system receives, transforms, remembers and returns. Choose a classic DFD when the question is about data and system boundaries. Label arrows with the data they carry; an arrow does not state which operation runs first.
Choose one graphical dialect
Both collections use processes, external entities, data stores and directed data flows. The appearance differs while those core meanings remain the same.
| Element | Yourdon / DeMarco | Gane / Sarson | Meaning |
|---|---|---|---|
| Process | Circular process | Rounded process with a number area | Transforms input data into output data; name the transformation with a verb phrase. |
| External entity | Rectangle | Rectangle | A source or recipient outside the modeled system. |
| Data store | Parallel open lines | Open-ended store with an identifier area | Information retained for later use; name the information rather than its storage technology. |
| Repeated external entity | Repeated-entity symbol | Repeated-entity symbol | Another occurrence of the same external source or recipient, used to shorten routes. |
| Repeated data store | Repeated-store symbol | Repeated-store symbol | Another occurrence of the same logical store, with the same name and store number. |
| Annotation | Explanatory note | Explanatory note | An assumption or explanation about the view; it is not a transformation, entity or store. |
| Data flow | Named directed arrow | Named directed arrow | Information moving between allowed elements; its direction does not determine execution order. |
Each dialect provides these six object choices and the Data flow relationship. A repeated symbol adds a visible occurrence, not another logical item or an automatically synchronized copy. Keep its text and reference consistent with the original.
Use one dialect throughout a view so readers do not have to interpret mixed conventions. A store describes retained information, not a particular storage technology; “Orders” is usually a clearer logical name than “SQL server”.
Edit the order-processing example
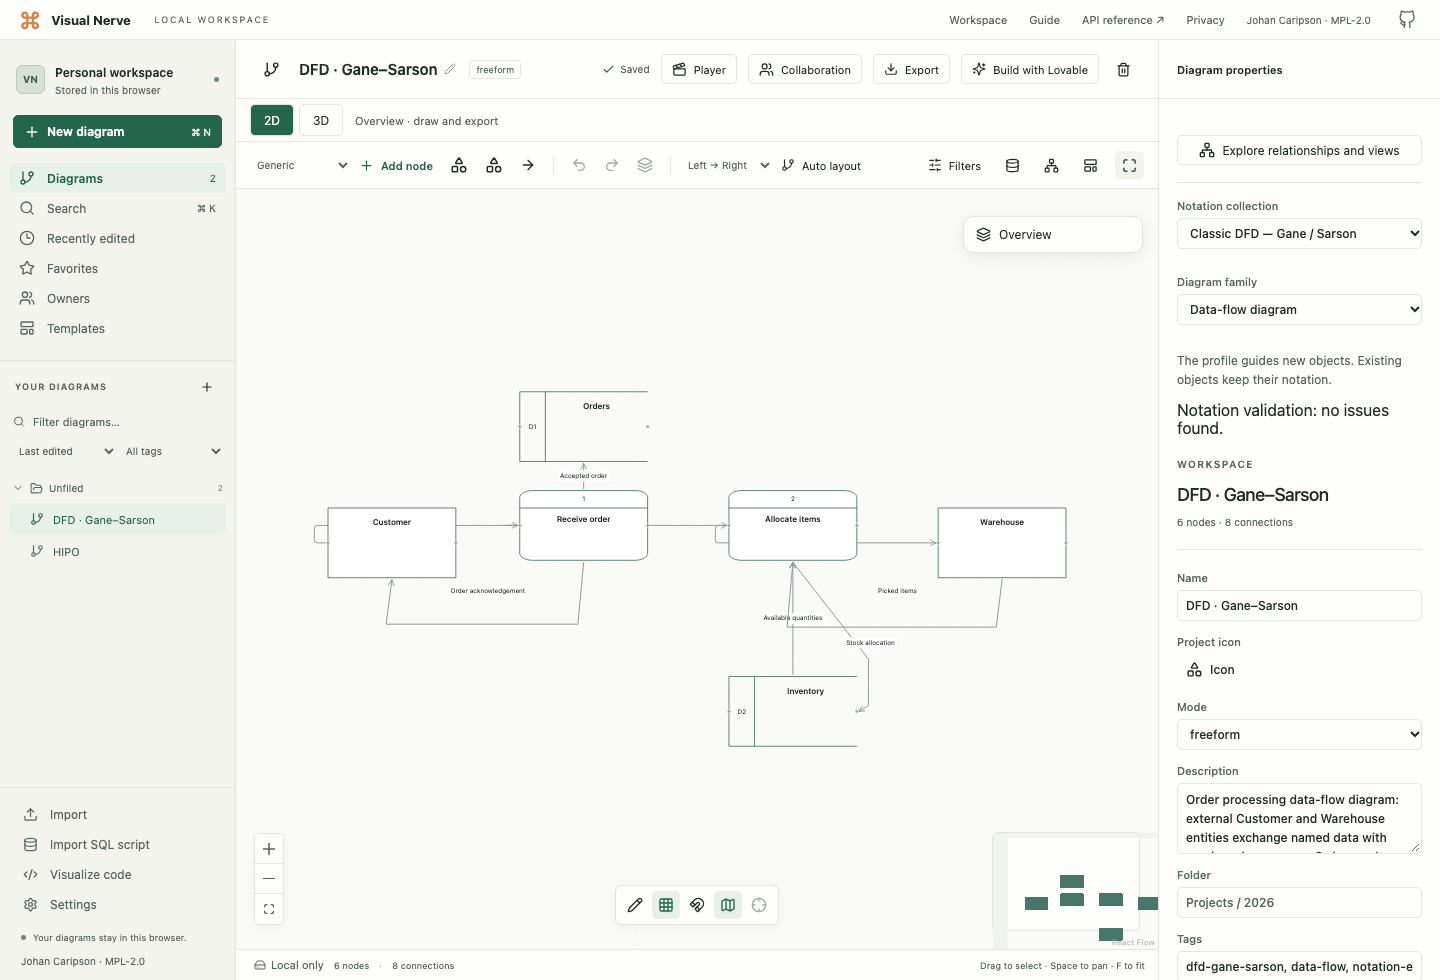
- Choose New diagram → DFD · Yourdon–DeMarco or DFD · Gane–Sarson. Both examples describe the same order-processing information.
- Follow Order request from Customer to Receive order. The process returns an acknowledgement and records the accepted order.
- Follow the accepted lines to Allocate items. It reads available quantities from Inventory, records a stock allocation and exchanges picking information with Warehouse.
- Select a process. Edit its title, Process number and Decomposition level in Notation properties. Use a verb phrase for the transformation.
- Select a data store. Give it a noun phrase and Store number. Select a flow and name the actual record, message or information it carries.
To add an element, choose Notation collections, select the desired DFD collection and find the process, entity, store or annotation. Select a connection and choose Data flow as its Relationship notation.
Draw a context and refine it
A context view represents the whole system as one process surrounded by external entities. Use it to agree the system boundary and the data that crosses it. A more detailed view replaces that system process with numbered transformations and internal stores.
Keep the names and meanings of the external inputs and outputs consistent between levels. A detailed view should explain those flows rather than silently introducing or dropping them. Decomposition level records the draft’s level; it does not automatically create a child diagram or prove that two diagrams balance.
Repeated entity and store symbols can shorten routes in a crowded drawing. They represent another occurrence of the same logical item. Keep their names and numbers consistent, use Related module or classifier to identify the original object when appropriate, and explain the repetition in the description.
Check common mistakes
Every meaningful transformation needs enough input information to explain its outputs. A process with only inputs hides a result; a process with only outputs creates unexplained information. Review data names, not just the number of arrows.
Route entity-to-entity, entity-to-store and store-to-store exchanges through the transformation that is responsible for them. Use separate named arrows for a request and a response when they carry different information. A flow direction is an information direction, not an association multiplicity or a control decision.
The editor’s notation review checks selected structural issues. It does not execute transformations, manage a complete data dictionary or automatically reconcile separate diagram levels. See notation editing and review .
Sources
The Yourdon collection follows Edward Yourdon’s Structured Analysis, Chapter 9: Dataflow Diagrams . The MIT research discussion of data-flow diagrams, section 5 gives an accessible explanation of the same process, store, terminator and flow model with a Yourdon example. The Gane–Sarson dialect follows Chris Gane and Trish Sarson’s Structured Systems Analysis: Tools and Techniques , originally published by Improved Systems Technologies in 1977, with a Prentice-Hall edition in 1979.