Choose a layout to make the diagram easier to read. Layout changes placement; it does not discover missing relationships or prove that a process runs in that order. Keep connection labels and object descriptions meaningful.
Grow a mind map
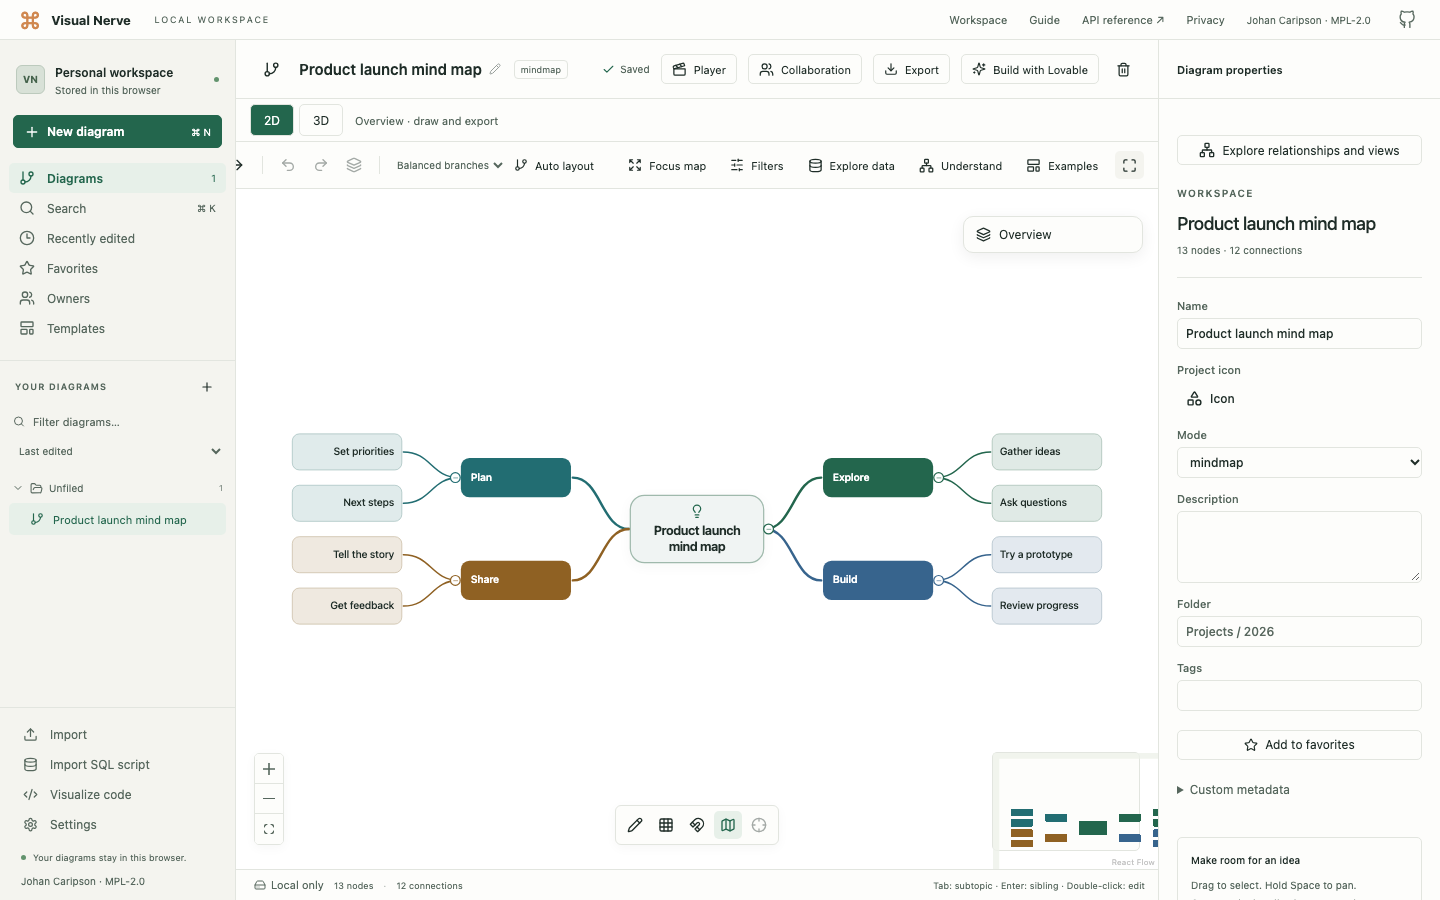
- Create a diagram from Mind Map. Its central topic takes your diagram name.
- Select a topic and choose Add subtopic, or press Tab.
- Type the new topic’s title. Press Enter to create a sibling at the same level.
- Double-click or press F2 to edit an existing topic. Longer explanations belong in Description.
- Collapse a branch to keep the central story readable; expand it when discussing the detail.
- Use Focus map to give the map the whole workspace by hiding surrounding panels. Exit focus restores the panels; the graph itself stays intact.
On a phone, select the topic and use the compact add controls or Diagram actions. Use Edit for its longer fields. Keyboard topic editing applies when a hardware keyboard and canvas focus are available.
Choose and apply a layout
Select the layout direction in the toolbar, then choose Auto layout.
| Layout | Use it for |
|---|---|
| Balanced branches | A central mind map with room on both sides for main branches |
| Left / Right | A horizontal progression or dependency chain |
| Up / Down | A vertical flow or layered hierarchy |
| Radial | A central idea with surrounding connected topics |
Mind maps default to Balanced branches. Auto layout reserves space for subtopics and keeps manually arranged contents inside spatial groups in balanced mode. It is explicit and undoable. After it finishes you can still drag individual objects. If the diagram changed while calculation was running, apply the layout again to the current graph instead of using an outdated result.
Change the diagram’s mode
With nothing selected, use Diagram mode in Properties. Ordinary modes reuse the same objects, types, parents, positions and relationships. This is useful when you want another presentation of the same information. Switching between 2D and 3D is a separate view change; it does not convert the diagram’s meaning. How 3D works .
Process Simulator has a separate semantic model. Use its dedicated template and Assumptions , rather than expecting ordinary layout changes to create processing behavior.
Put work on a timeline
- Create Project Timeline, or change an ordinary diagram to timeline mode.
- Select an object and give it a Start date and End date. Use Due date for a deadline annotation where appropriate.
- Choose the timeline scale: day, week, month, quarter or year.
- Drag a timeline object to change its dates and vertical lane.
- Connect work items and label dependency lines. Dates control horizontal placement; connections remain part of the graph.
- Fit the timeline and review the range before exporting.
The bundled timeline’s example dates are placed relative to the day you create it. A timeline visualizes the dates you enter; it does not automatically calculate critical paths, move downstream tasks or infer resources. Use Process Simulator when you need capacity, waiting or costs to affect outcomes.
Readable layouts for large diagrams
- Start with an overview, then expand the relevant branch. Semantic overview can summarize thousands of objects.
- Filter or focus a region before discussing detail. Hidden objects stay saved.
- Use meaningful labels and consistent icons instead of relying only on color.
- Keep the native 2D arrangement readable even when you primarily explore in 3D: PNG, PDF and SVG use it.
- Enlarge long code cards before an export; saved size determines what is visible in a rendered card.
Common problems
| Symptom | What to check |
|---|---|
| Auto layout did not preserve my manual spacing | Layout explicitly rearranges objects. Undo to recover it, then apply a different layout or adjust the result |
| A branch is missing | Check collapsed parents, filters and semantic overview |
| A timeline item appears at the wrong date | Inspect its actual Start date and End date rather than only its dragged position |
| The drawing became hard to read after a mode change | Fit, review the selected layout and check the 2D arrangement |
Continue with editing and drawing , large-diagram exploration or a filmed walkthrough .