An object describes something; a connection describes how two things relate. Use the title for quick recognition, the description for explanation, and the connection label for the meaning of the line. Colors and icons reinforce that meaning.
Navigate the canvas
| Task | Desktop | Phone / touch |
|---|---|---|
| Pan | Hold Space and drag; middle/right-button drag also works | Drag empty canvas with one finger |
| Zoom | Scroll over the canvas or use zoom controls | Pinch with two fingers, including over a card |
| Fit the diagram | Fit diagram or F when the canvas is active | Fit control in the canvas tools |
| Centre selected objects | Crosshair / focus control below the canvas | Select, then use the focus control |
| Select one | Click a card or line | Tap a card or line |
| Extend selection | Shift, Ctrl or Cmd with selection | Use Shift/Ctrl/Cmd with a hardware keyboard where available |
| Select an area | Drag a selection box over the 2D canvas | Pan is the default empty-canvas gesture |
| Edit properties | Select, then use the right panel | Select, then tap Edit |
The minimap is pannable and zoomable. Grid and magnet controls toggle canvas dots and snapping. These are view aids; they do not change the meaning of connections. If a diagram seems empty, use Fit, check filters and collapsed groups, and return to Details from semantic overview.
On a touch screen, two fingers navigate the 2D view even when they start over an object or its scrollable details. The gesture zooms around the space between your fingers and does not move the object. Lift both fingers before dragging an object or scrolling its details with one finger again.
Create and describe an object
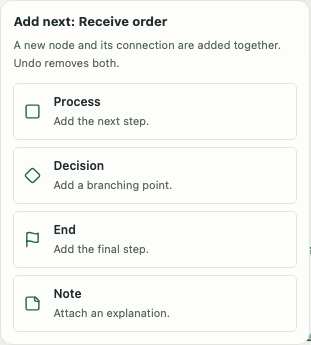
To continue from an existing object, select it and choose Add next beside the card. Pick Process, Decision, End or Note. The new object is positioned nearby and connected automatically; Undo removes the object and its connection together. Timeline diagrams offer Timeline item. Mind maps keep their dedicated Add subtopic action.
- Choose a New node type, then Add node. Mind maps use Add subtopic instead; see mind maps .
- Select the new card and enter a short Title, or double-click its title to edit it on the canvas.
- Use Description for the explanation someone should read or hear in a walkthrough. Notes can hold supporting detail.
- Choose Type, Area icon, Color and Status to make the object recognizable. Supported status choices are Planned, In progress, Blocked and Done; None clears it.
- Assign an Owner, add Tags, and set Start date, End date or Due date where relevant.
- Add a URL if the object has a useful external reference. Use an absolute HTTP(S) link.
- Check Saved before leaving.
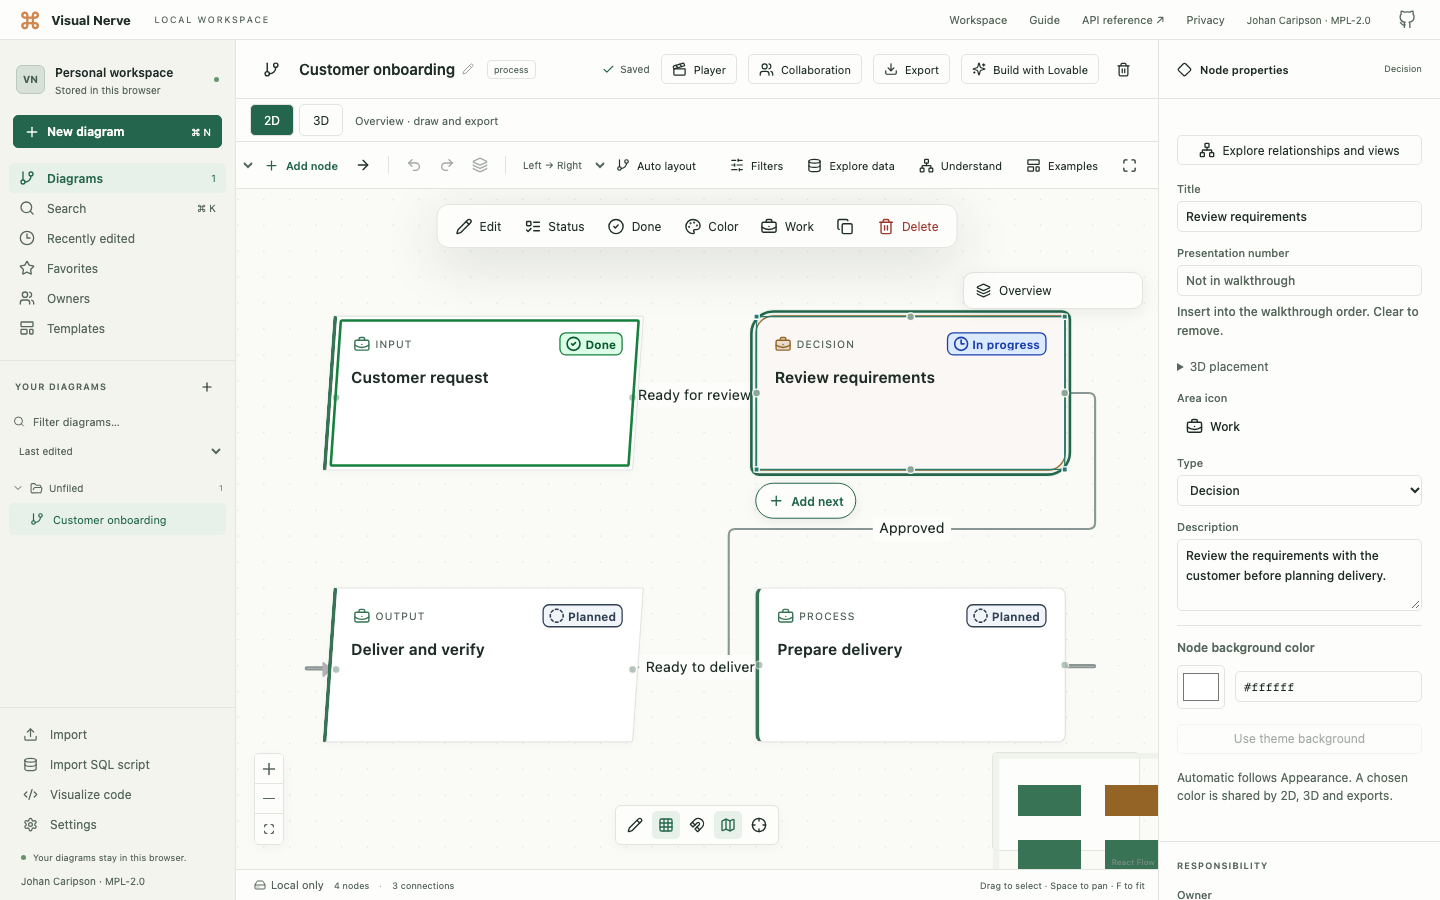
The status belongs to the object and is preserved in other views and native exports. It does not execute a process or delete completed work. In Process Simulator, configure simulated completion and outcomes in Assumptions ; an editing status is a separate annotation.
Rename an object on the canvas
Double-click an object’s title, double-tap it on a touch screen, or select one object and press F2. Edit the title where it appears. Enter or moving focus saves it; Escape cancels the draft. This works for ordinary cards, IBM symbols and mind map topics in 2D. In 3D , double-click or double-tap the object’s face, or use F2 after selecting it. Undo reverses a saved rename.
Set an object’s background
Select an object and choose Node background color in Properties to fill its card or symbol. Color controls its accent and outline independently. Choose Use theme background to return the fill to the current light or dark appearance. The saved background follows the same object between 2D and 3D and is retained in native JSON and backups.
Use the selection’s quick actions
The floating selection toolbar offers Edit, Status, Done / Reopen, color/icon choices, Duplicate and Delete. With multiple objects selected, status, color and icon choices apply to the whole selection. Mixed statuses are shown explicitly until you choose a shared value. Done marks the selected objects complete; Reopen changes an all-Done selection to In progress. These operations are undoable. The mind map’s Delete branch removes the topic and descendants together.
Pick a visual object type
| Types | Useful visual meaning |
|---|---|
| Generic, Process, Decision | A general object, a step, or a branching choice |
| Start, End, Milestone, Timeline item | A boundary, significant event or dated item |
| Person, Team | A person or team within the diagram; reusable responsibility is assigned through Owner |
| System, External system, Input, Output | Components and information entering/leaving a system |
| Document, Database, Note | A document, data store or annotation |
| Group | A visual container for related objects |
Type controls the native card’s representation. Imported semantic details and simulator assumptions add their own meaning; changing a card’s shape alone does not run code, query a database or create processing behavior.
In a blank diagram or any ordinary template, use IBM symbols in the editing toolbar to add a classic process, card, tape, storage or communication glyph. To change an existing object, use IBM flowchart symbol in Properties. This works in Mind Map, Timeline, Process Map, architecture and responsibility diagrams as well as flowcharts. The selector changes appearance while retaining the object’s ordinary type and information; Default node appearance clears the glyph.
The Classic Flowcharting template provides an editable starting set based on the IBM GX20-8020 stencil. You can use the same symbols without starting from that template. Process Simulator and Time Series & Signal Analysis retain their own tools; existing saved symbols can still be changed or cleared in Properties. See IBM flowchart symbols for choices and completed composites.
Use a notation collection
Choose Notation collections in an ordinary diagram’s toolbar to add HIPO, classic DFD, UML or BPMN symbols. Select an object to edit its notation fields, sections, references or named ports; select a relationship to edit its notation and endpoint roles. A document’s notation profile guides creation and review while existing objects retain their explicit notation. Choose the right collection and follow the editing steps .
A notation object’s + → Add next menu offers symbols from its collection and diagram family. It creates a fresh element with empty sections and a starting relationship, rather than copying the selected object’s values. Use the palette for ports and boundary events that need an owner attachment.
Read long code and schema cards
In 2D, code cards have an internal scroll area. Scroll inside it to read retained detail without zooming the entire diagram. Select the card and drag a corner handle to enlarge it; move the card by its header. Sizes save and support Undo. Full imported semantic properties remain available in Properties. Image, 3D and video views show the top of a card at its saved size, so enlarge it before exporting detail that must be visible. Source code , SQL .
Custom metadata
Use Custom metadata for structured object information that the ordinary fields do not cover. Preserve the expected JSON shape and review errors before applying. Imported objects can also have source-specific metadata; use their dedicated inspectors to understand it rather than guessing from positions or colors. Native JSON/backups retain metadata; visual exports show the visible appearance.
For your own annotation, enter an object such as {"risk":"high","ticket":"OPS-123"} and choose Apply metadata. Arrays or invalid JSON are rejected. Keep imported reserved structures intact when adding your own fields.
Connect two objects
- Select the objects and use Connect nodes. With exactly two selected objects, Properties also offers Connect selected nodes.
- Alternatively drag a connection handle from one card to another.
- Select the line. Enter its Label, for example “depends on”, “Yes” or “sends invoice to”.
- Set Relationship, Direction and Style. Direction can be forward, backward, both or none; style can be solid, dashed or dotted.
- Add a Description if the line needs explanation.
- If the endpoints are wrong, change Source or Target in connection properties, or reconnect an endpoint on the canvas.
Direction and label carry meaning independently. A two-way relationship can be useful for collaboration; a SQL foreign-key arrow describes a reference; a simulator particle route describes a path work can actually take. Label those differences so readers do not mistake every arrow for execution order.
Deleting an object also affects its attached connections. Undo is useful for a recent mistake; version history is useful before a larger restructuring.
Group and collapse objects
- Select related objects with a selection box or extended selection.
- Choose Group selection, or press Ctrl/Cmd+G. A group/container gives the set a shared visual boundary.
- For a selected object, Parent / container controls its hierarchy. A parent cannot be its own descendant.
- Collapse a group or topic to reduce detail; expand it to return to its children.
- Ungroup with Ctrl/Cmd+Shift+G when the boundary is no longer useful.
Hierarchy is different from a directed connection. A topic can belong to a group and also depend on an object outside it. Semantic overview is another way to summarize a large graph without permanently regrouping the original objects.
Owners, search and filters
Assign responsibility
Open Owners to create people, teams, departments, systems or organizations. Add a name, color and relevant contact details. Select an object, choose its primary Owner, and use Additional owners when more than one is responsible. These are reusable workspace records. Selecting an owner does not send notifications.
Find an object or diagram
Use Ctrl/Cmd+F or Ctrl/Cmd+K for global search. Search covers diagrams, titles, descriptions, tags, owners and metadata. Choosing an object result opens its diagram, selects it and centres the view. For a relationship question such as “what depends on this?”, use Ask diagram rather than text search.
Narrow what is visible
Open Filters and choose owner, status, type, tag or date criteria. Dim keeps nonmatching objects as context; Hide removes them from the current view. Filters do not delete saved objects. Reset filters to get the overview back. A CSV’s row filters are separate: they change which source rows contribute to an analysis. CSV filters .
Organize projects
With no object selected, diagram properties provide Name, Description, Folder, Tags and a favourite control. Folder paths organize the Projects list. Use Diagrams, Recently edited, Favorites, tag filters, project search and Sort diagrams to find work. Project-list search narrows the list; global search can find an object inside another project.
Click the document title to rename it. With no selected object, F2 also opens title editing. Enter or moving focus saves; Escape cancels the draft. Choose the project icon beside the title or in diagram properties to identify it in the list. The project icon is separate from an object’s Area icon.
Draw over the diagram
- Select the pencil in the bottom canvas controls.
- Choose a pen color and thickness, then draw using a mouse, finger or pen.
- Use Eraser to remove a whole stroke. Clear drawing removes the layer’s strokes; Undo can restore the change.
- Choose Done drawing or press Escape to return to editing objects and connections.
- Use the eye control to hide or show the saved layer.
The layer follows pan and zoom and saves with the diagram. It does not alter objects, connections, source rows or calculations. PNG/PDF/SVG include visible drawings; JSON and full backups retain strokes even when hidden. Fit includes visible strokes, and a drawing-only diagram can be exported. Draw in 2D; use the same saved objects in 3D. Explain a pen annotation in written instructions if it must become part of a Lovable brief .
Copy, undo and delete deliberately
Copy/paste carries selected objects and the relevant relationships. You can paste into another diagram; CSV objects copied away from their source keep calculated measures as snapshots, while source rows stay with the original data diagram. Duplicate creates another editable set. Undo/Redo covers local editing operations and is bounded in memory; it is not a permanent audit log and is not a substitute for a backup.
Delete diagram is a separate confirmed action. It removes that diagram’s saved content; make a JSON export or full backup first if you may want it again. Delete all local data is separate in Settings. Storage and deletion .
Keyboard reference
These shortcuts apply when the canvas is active. Focus in a text field, dialog, code scroll area or another editing control can give keys their normal text-editing meaning.
| Action | Shortcut |
|---|---|
| New diagram | Ctrl/Cmd+N |
| Global search | Ctrl/Cmd+F or Ctrl/Cmd+K |
| Undo | Ctrl/Cmd+Z |
| Redo | Ctrl/Cmd+Shift+Z or Ctrl/Cmd+Y |
| Copy / paste | Ctrl/Cmd+C / Ctrl/Cmd+V |
| Duplicate selection | Ctrl/Cmd+D |
| Group / ungroup | Ctrl/Cmd+G / Ctrl/Cmd+Shift+G |
| Delete selection / branch | Delete / Shift+Delete |
| Fit | F |
| Nudge selected objects | Arrow keys, 10 px; Shift+Arrow, 50 px |
| Pan | Space+drag |
| Mind map child / sibling | Tab / Enter |
| Rename selected object | F2; double-click or double-tap its title in 2D, or its face in 3D |
| Rename diagram with no selected object | F2, or click the document title |
| Leave drawing / cancel a gesture | Escape |
When something looks wrong
- The object vanished: reset filters, expand its parent and fit the diagram. A view change normally does not delete content.
- A code card moves while you try to read it: scroll inside the card body; drag the header to move it.
- Undo does not recover older work: use a saved snapshot or restore a backup. Undo history is not persisted indefinitely.
- Another tab changed this diagram: resolve the conflict before closing the current tab; see conflict choices .
Continue with layouts and timelines , 3D , or understanding a large graph .