A CSV diagram helps you answer “What am I looking at?” without drawing one object for every row. Group a large file into customers, regions or products, show useful measures, then follow the groups that need attention.
Start with a small, useful view
Drop a CSV onto the workspace or choose Import. On a phone, open Projects and choose Import in the drawer. The Import CSV data dialog prepares the analysis before you save a diagram.
The reader accepts comma, semicolon and tab separators, quoted fields, multiline cells, byte-order marks and duplicate column names. Original cells remain strings, preserving identifiers such as 00127. Duplicate column labels have separate internal identities.
Suppose your file has 100,000 transactions and 2,000 customers:
Region;Customer;Product;Amount
North;310293 - AAA Logistics;Service;1.234,56
North;310293 - AAA Logistics;Parts;125,00
South;882010 - BBB Transport;Service;950,00
Start with Region → Customer, a count and a sum of Amount. Filter Customer to names starting with AAA, and show only a small number of groups. You can add Product as another grouping level later.
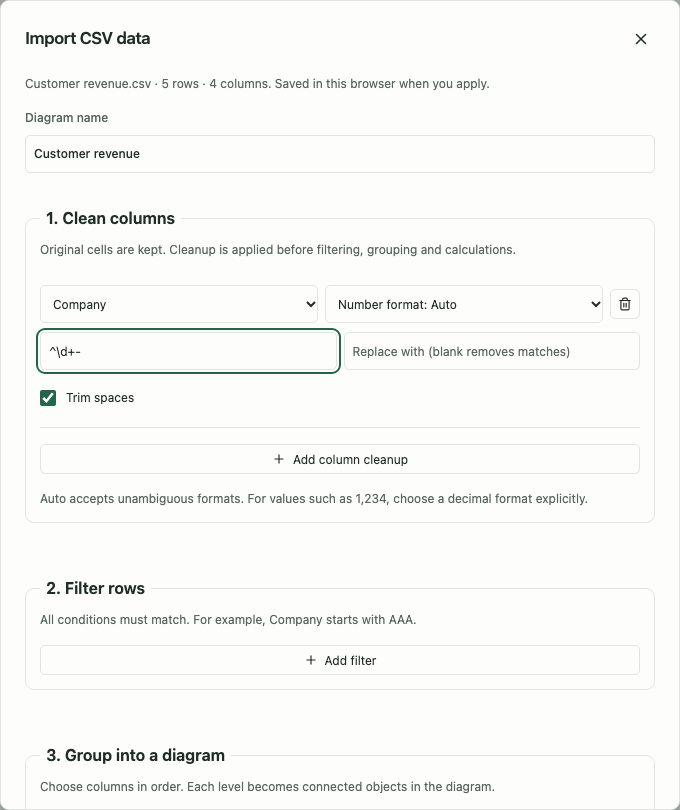
Clean columns before filtering and grouping
In 1. Clean columns, choose the column and its cleanup rules.
- Trim whitespace when
AAA LogisticsandAAA Logisticsshould be the same group. - Use a regex replacement when labels contain a removable prefix.
- Set an explicit number format when punctuation could have more than one meaning.
For 310293 - Företag, use this pattern and leave the replacement empty:
^\d+\s*-\s*
The pattern removes digits at the beginning, optional spaces, a hyphen and following spaces. It leaves Företag. Review the preview before applying it: cleanup can deliberately merge labels, but an overly broad pattern can also merge unrelated companies.
Cleanup changes the analyzed value. Original values remains available when you inspect source rows.
Decimal dots and commas
Automatic number recognition accepts examples such as 1.234,56, 1,234.56, 12,50, 12.50, spaces and signs. A value such as 1,234 is ambiguous: it could mean one thousand two hundred thirty-four or one point two three four.
For an ambiguous column, choose decimal dot or decimal comma explicitly in Number format. That choice applies to numeric filters and calculations. Empty and invalid numbers are excluded from numeric measures and reported; they are not silently treated as zero.
Filter rows to answer one question
In 2. Filter rows:
- Choose the column.
- Choose an operator, for example Starts with.
- Enter
AAA. - Add another filter if needed.
Multiple filters use AND: a row must pass every filter. Text filters ignore case by default. Numeric filters use the selected number format.
In the example, cleanup runs before the Customer starts-with filter. Without removing the numeric prefix, 310293 - AAA Logistics would not start with AAA.
Build a hierarchy and choose measures
In 3. Group into a diagram, choose the grouping columns in order. Region → Customer → Product creates a hierarchy: products within each customer, customers within each region.
Choose the measures that help answer your question:
| Measure | Meaning |
|---|---|
| Row count | Every matching source row, including rows with an empty or invalid numeric cell. |
| Sum | Total of valid numbers. |
| Average | Valid-number total divided by the number of valid numeric values. |
| Median | Middle valid value, useful when a few large values distort the average. |
| Minimum / Maximum | Smallest or largest valid value. |
| Distinct count | Number of distinct values in the selected column. |
Parent-level averages and medians are calculated from their matching source rows. They are not averages or medians of child cards’ displayed measures.
Set Groups per level, Sort groups by and Order. Sorting by a measure can expose the largest customers or busiest categories. A displayed page limits the cards you see, not the rows used in a measure.
Review Preview, then choose Create data diagram. When you reopen an existing analysis, the action is Apply data view.
Read a group and follow its source rows
CSV groups are normal diagram objects connected by native relationships. Select a group to:
- Choose which measures and source columns appear on its card.
- Open Source rows to inspect up to 100 matching rows.
- Toggle Original values to compare the imported cell with its cleaned value.
- Choose Why this value? beside a measure for the calculation and row evidence.
- Choose Explore this group to follow that group, or All data to reset.
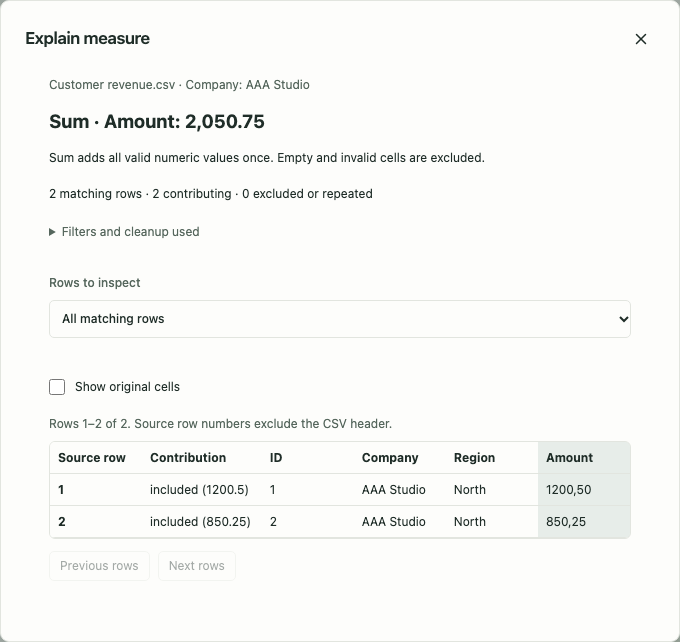
The evidence view recomputes the measure using the current grouping, filters, cleanup, number formats and connected-source scope. It shows contributing, excluded or repeated rows in pages, with source data-row numbers. Changing an evidence page does not change the calculation.
Use Previous groups and Next groups to browse a level with more groups. With no object selected, choose Change grouping and measures to reopen the analysis configuration.
On a phone, select the group and choose Edit to open Properties. The same measures, source rows and exploration controls appear in the scrolling sheet.
Keep diagram work while changing perspective
Move or rename groups, add ordinary objects, draw notes, assign owners/status and create connections. Change connection labels, directions and styles as you would in any diagram.
Changing a CSV filter or grouping hides other groups and their connections without deleting your edits. Bringing a group back restores its retained identity and relationships. A generated connection that you manually delete or reconnect stays changed when the analysis runs again.
Copying a CSV card within the same data diagram retains access to its source rows. Copying it into another diagram preserves its measures as a snapshot without copying the original rows.
PNG/PDF/SVG show the current data view. Native JSON and complete backups include original source cells, analysis settings and retained hidden objects. Review source values before sharing these restorable formats.
When the view is too dense or a value looks wrong
| Symptom | What to check |
|---|---|
| A customer appears twice | Compare whitespace, cleanup and the grouping path. Identical names in different parent groups can be separate objects. |
| A number is excluded | Inspect Why this value?, Original values and the column’s number format. |
| Sum and count seem inconsistent | Count includes every matching row; numeric measures exclude invalid or empty numbers. |
| A filtered customer disappears | Filters use AND and cleaned values. Check each operator and reset group focus with All data. |
| Not every group is visible | Use paging or a larger group limit. Measures still use all matching rows. |
| Cleanup joined unexpected names | Narrow the regex or remove that cleanup rule; inspect Data quality for collisions. |
| Import or analysis exceeds a limit | Reduce rows/columns, grouping depth or expensive regex work before retrying. An oversized source is not accepted as partial totals. |
Size, performance and local storage
The default file limit is 50 MB. Settings → Import file size → Maximum import file size (MB) accepts a whole number from 50 to 1024; choose Save import limit. The UI uses MB for MiB, so 1024 MB is 1 GB. Imports up to 50 MB are supported and guaranteed. Higher limits are experimental and can fail because of memory or format constraints. The preference stays in this browser and is excluded from backups.
CSV limits remain 200,000 rows, 200 columns and 10 million cells. A view contains at most 600 generated objects, up to 200 groups per level, with a bounded history of 12,000 retained data objects. Reduce grouping depth or explore one group when a view becomes dense.
Parsing, cleanup, profiling and aggregation run in a background worker. A ten-second watchdog stops expensive work, including pathological regex patterns; the next request can start a fresh worker. Increasing the file limit does not increase structural or worker limits.
The original source is stored once in local IndexedDB, separately from the diagram cards. Ordinary edits do not copy the entire CSV again. Nothing is uploaded to S3 or a data-analysis service. Browser storage capacity depends on the device, so keep a complete backup .
Older CSV diagram files with a title column can use Import as existing diagram rows instead in the preview.
Continue with Connected data, quality and refresh to compare files and repeat an analysis, or Understand large diagrams to summarize the resulting graph.