Open the workspace · Browse all guides
Understand a process before changing it
Map an order, approval, delivery or support workflow. Give each step a description, identify the responsible owner, and label the connections with their business meaning. Mark blocked or completed work explicitly.
Use a process map to explain the sequence. Use Process Simulator when staffing, queues, demand or cost should determine what happens over time. A drawn arrow alone does not calculate capacity.
Try this: model a kiosk’s existing customers, add package pickup, then compare low and high package demand through the same staff and counter.
Model and compare a process · Draw its workflow
Get an overview of a large customer file
Start with transactions, orders or cases in a CSV. Clean identifiers and number formats, group by region and customer, then show a count and a useful financial measure. Filter to the customer names or relationships you want to inspect.
Connect another file through a deliberate key match, such as Customer ID. Review missing and duplicated keys. Follow a group to its rows and use Why this value? when a total needs explanation.
Try this: remove a numeric company-name prefix, keep names beginning with AAA, and compare revenue with the number of support cases.
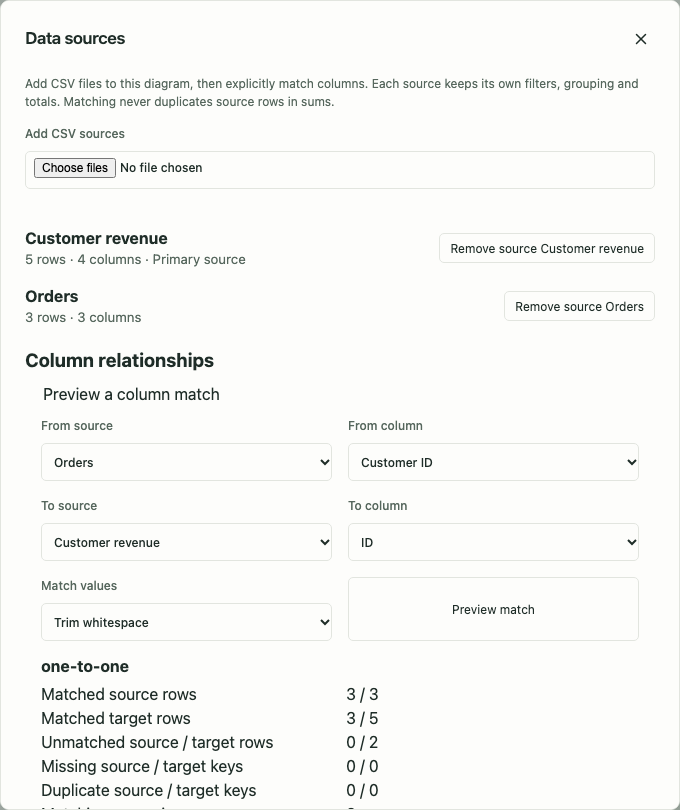
Explore grouped data · Connect sources
Investigate changes in growth and retention
Map customer, churn, MRC, sales or operational history without AI. Distinguish balances from period flows and rates, preserve missing observations, and measure a change before interpreting it.
Try this: open Growth & Churn, inspect the persistent retention shift, configure three complete months of confirmation, and review the resulting signal history. Compare Baseline, Current trend and Stress assumptions without modifying the observations.
Signal Lab can reproduce detection against chronological history. Evaluating whether signals precede an outcome requires an explicit outcome and horizon; correlation and historical fit alone do not establish cause or predictive reliability.
Start time-series analysis · Read the practical guide
Read an unfamiliar codebase
Import a ZIP code project, a folder, or the files you want to understand. Folder relationships summarizes connected directories with descendant file counts; File overview shows the supplied modules and their recognized dependencies; Declarations and dependencies shows individual functions, classes, paragraphs or other language structures.
Inspect file and line evidence on a connection. Keep heuristic and unresolved links visible as uncertainty. The analyzer does not execute the project, resolve every dynamic call or discover code you did not supply.
Try this: import a Markdown handbook ZIP to follow internal document links, or load a COBOL program and follow PERFORM calls between its numbered paragraphs, then inspect the file resources its paragraphs read and write.
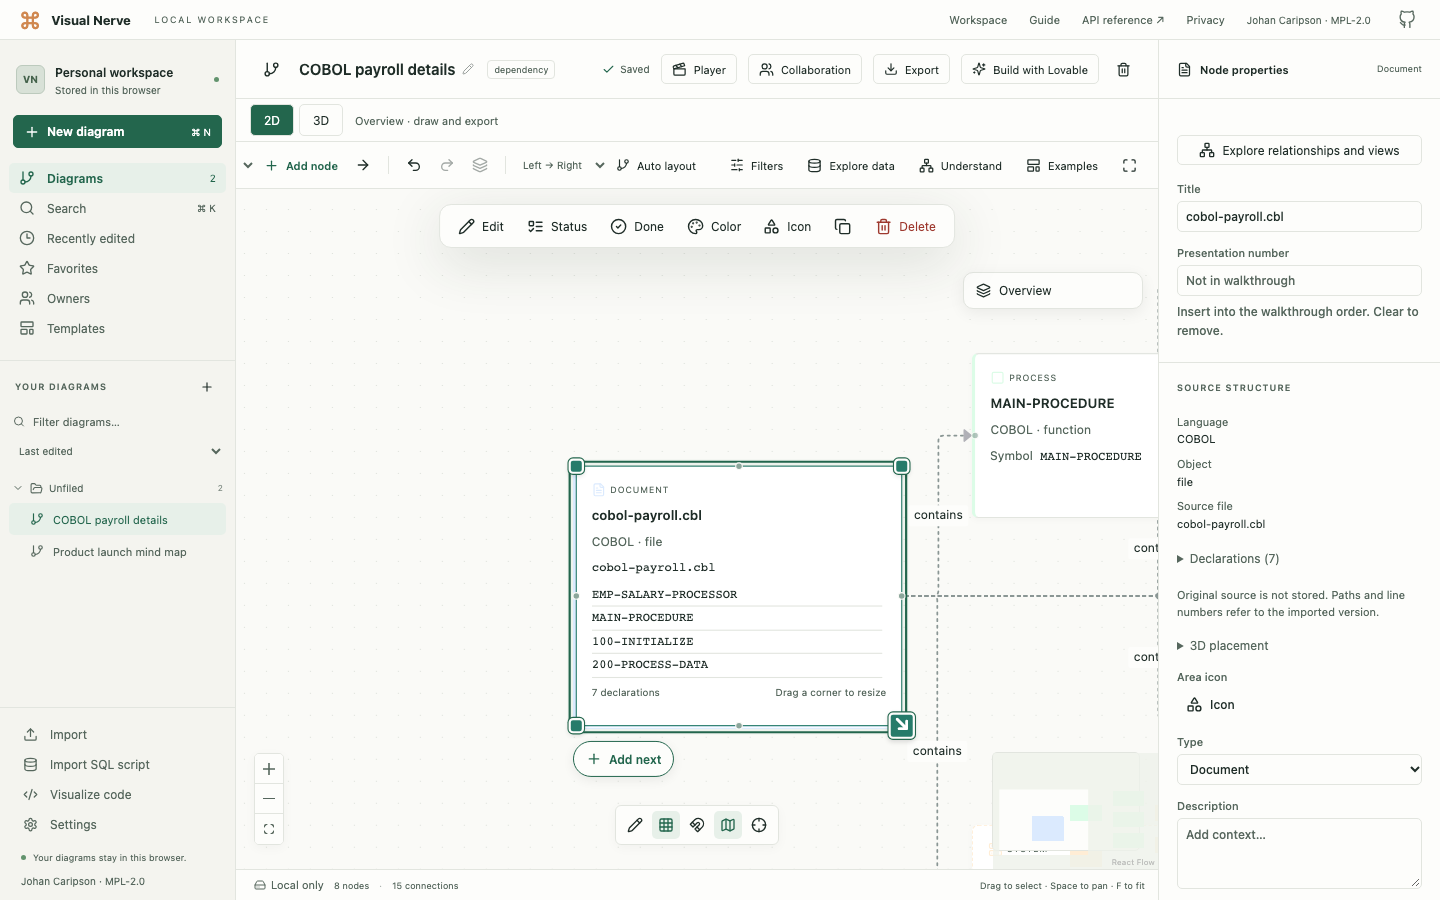
Visualize source code · Ask a relationship question
Review a SQL query or database schema
Use SELECT/WITH visualization to follow aliases, joins and outputs. Repeated aliases of one table remain separate roles. Use schema import to review columns, keys and foreign-key references from recognized CREATE/ADD definitions.
Missing definitions and ambiguous references remain explicit. SQL visualization describes parsed structure; it does not retrieve rows, inspect the live database or generate an optimizer execution plan.
Try this: compare an organization, its invoice organization and its parent organization as distinct sources, then inspect which source contributes to each output.
Explain a system to another person
Begin with a clear 2D arrangement, then use 3D when another viewing angle helps reveal a dense region. Number the objects for a walkthrough or group them into storyboard scenes. Add narration and subtitles to explain one part at a time.
PDF communicates a printable overview. A video communicates an ordered explanation. Native JSON lets another Visual Nerve workspace reopen and edit the diagram; a complete backup transfers a broader workspace.
Try this: create a four-scene onboarding explanation: request, review, preparation and delivery. Keep each scene’s description specific enough to stand alone.
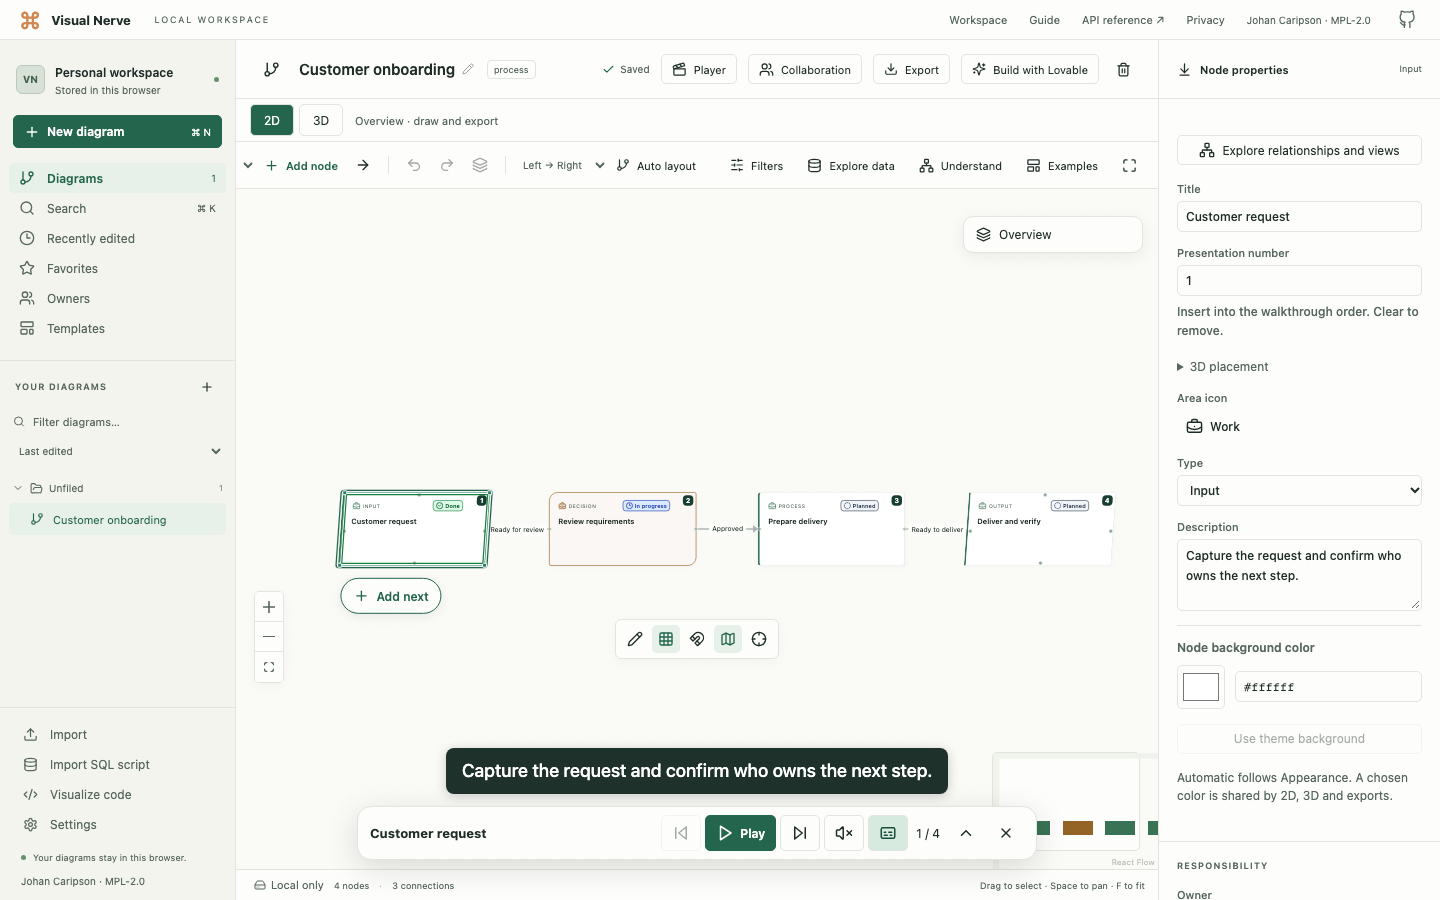
Present a walkthrough · Choose an export
Turn a worked-through diagram into an app brief
Describe the app you want, select the relevant diagram scope and review the Build with Lovable specification. Separate observed facts from proposed screens, business rules and unresolved decisions. Add answers before reviewing the exact prompt.
The handoff starts only when you choose to open Lovable with the reviewed text. Original CSV rows and raw source scripts are excluded, but descriptions, group values and recognized SQL expressions can still contain sensitive information.
Try this: use an invoice-approval workflow as the basis for a specification with assignment, review, delivery and an audit trail.
Prepare a reviewed app specification
Choose the boundary for your work
Everything above can be done through the UI. Optional local API and MCP access let connected tools work with the same browser model. There is no mandatory AI service, account or cloud database.
Before using sensitive data, consider the browser profile, the device, exports and any tools you grant access to. A local workspace is still data that needs a recovery copy and an appropriate device policy.